
In short, what you will discover in this article: a clear and simple definition of a topographic map, its key elements such as contour lines and scale, as well as practical tips on how to read and use it, especially for hiking. You will also understand the differences with other types of maps and the practical uses of this representation of terrain relief.
1. Definition — What is a topographic map?
1.1 Simple and concise definition
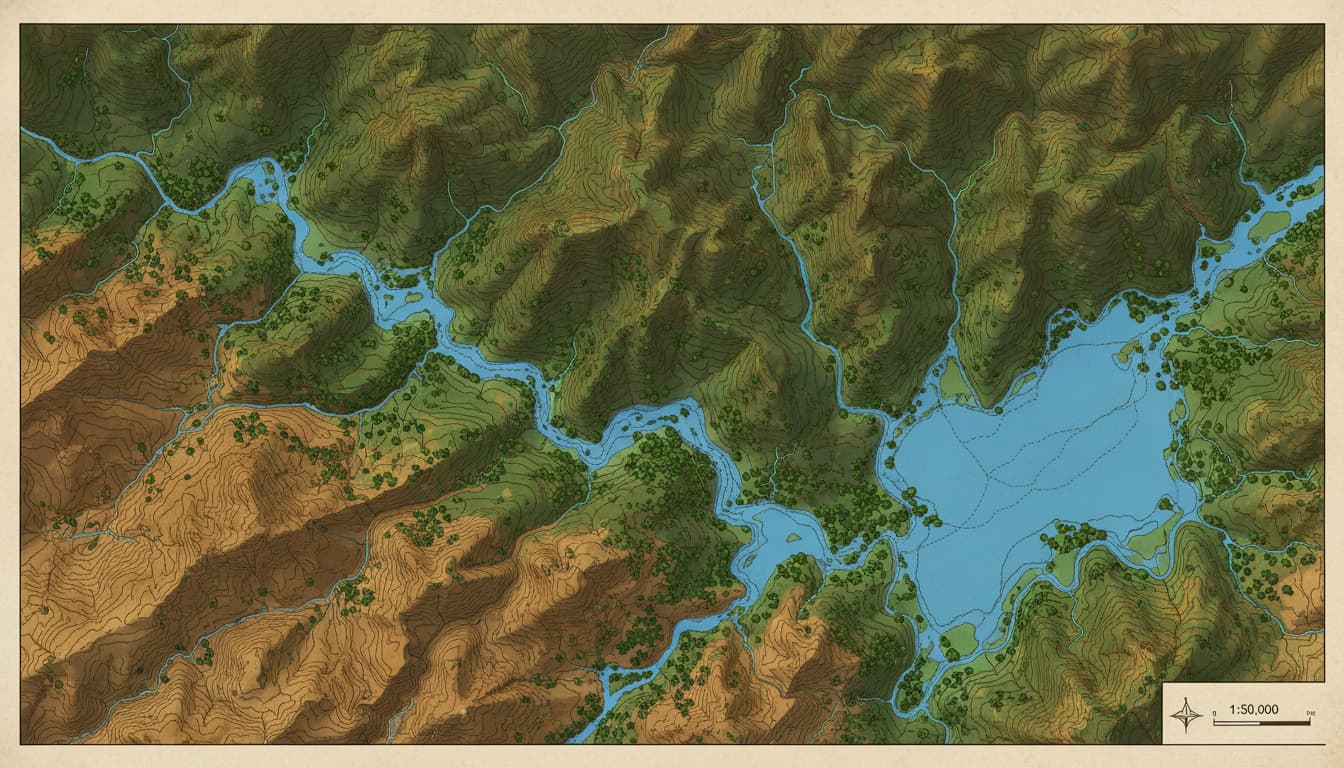
A topographic map is a detailed and accurate representation of the relief of the land and the natural or human elements present in a given area. It shows not only the shapes of the landscape but also the altitudes using specific techniques like contour lines. This map is used to visualize in two dimensions what is actually a three-dimensional space, thus facilitating orientation and understanding of the terrain.
1.2 Difference between a topographic map and other types of maps
Unlike a classic geographical map which may focus on roads or borders, the topographic map emphasizes the depiction of relief and landscape details. For example, a road map mainly shows traffic routes, whereas the topographic map also includes hills, rivers, forests, and buildings. This distinction is essential for activities such as hiking, where knowing the terrain is crucial.
2. Constituent elements of a topographic map
2.1 Contour lines — definition and reading
Contour lines are lines that connect points of the same altitude. They allow visualization of altimetric data and understanding the shape of the terrain: the closer the lines, the steeper the slope. Learning to read these lines is fundamental to estimate elevation changes and anticipate the difficulty of a route.
2.2 Scale and representation (graphic and numeric scale)
The map scale indicates the ratio between a measured distance on the map and the actual distance on the ground. It can be expressed numerically (e.g. 1:25,000) or graphically with a graduated bar. An accurate scale is essential to calculate real distances and plan a route precisely.
2.3 Legend, symbols, and colors
The legend explains the cartographic symbols used: roads, buildings, forests, water bodies, etc. Colors also help differentiate terrain types and altitudes (for instance, green for vegetation, blue for water). Understanding these codes makes for a quick and accurate reading of the map.
3. How to read a topographic map (practical guide)
3.1 Estimating altitude and slope from contour lines
To estimate altitude, simply identify values indicated on certain contour lines and interpolate between them. Slope is deduced from the distance between lines: close lines indicate a steep slope, while spaced lines suggest flat or gentle terrain.
3.2 Calculating distance and elevation gain on the map
To calculate distance, measure the length on the map and convert it using the scale. Elevation gain corresponds to the difference in altitude between two points, obtained by comparing contour lines. These calculations are essential to prepare a hike by assessing necessary duration and effort.
4. Types and formats of topographic maps
4.1 Paper maps vs digital maps
Topographic maps exist in paper format, often used for traditional hiking, and digital format integrated into GPS applications or mapping software. Digital maps offer interactive features such as zoom, real-time location, and data overlay.
4.2 Data formats (DEM, GeoTIFF, GeoJSON) and use with GPS/apps
Topographic data can be stored in different formats:
- DEM (Digital Elevation Model) for elevation models.
- GeoTIFF for georeferenced images.
- GeoJSON for vector data.
These formats are compatible with GPS devices and mobile apps, facilitating terrain analysis and navigation.
5. Sources and production of maps
5.1 Main sources (e.g., IGN, SRTM, LiDAR) and reliability
Topographic maps are produced from data collected by specialized organizations like the IGN (Institut national de l’information géographique et forestière) in France, or via technologies such as LiDAR and the SRTM satellite. These sources ensure high precision and reliability suitable for professional and amateur use.
5.2 Cartographic projections and impact on accuracy
Map projection transforms the Earth’s spherical surface into a flat surface. This process can introduce distortions, notably on distances and angles. Choosing the right projection is therefore important to maintain the precision needed for orientation and terrain analysis.
6. Uses and applications
6.1 Hiking and orientation
The topographic map is an essential tool for hiking. It allows you to follow a route, identify water points, shelters, and anticipate terrain-related difficulties. The French Hiking Federation specifically recommends using maps at a 1:25,000 scale for optimal accuracy in natural terrain.
6.2 Urban planning, engineering, and risk management
Beyond leisure, topographic mapping is used in urban planning to design constructions, in engineering for infrastructure projects, and in risk management to anticipate floods or landslides.
7. Limits and common errors
7.1 Resolution, updating, and geographic shifts
Maps may have limitations related to their resolution, update date, or geographic shifts. Such errors can affect accuracy, especially in rapidly changing areas.
7.2 Tips to verify the reliability of a map
To ensure reliability, it is advised to:
- Check the publication date.
- Compare multiple sources.
- Use official maps such as those from IGN.
- Supplement with up-to-date digital tools.
8. Practical example / mini-workshop
8.1 Reading a map for a hiking route (step-by-step example)
- Identify the start and end points on the map.
- Locate contour lines to anticipate ascents and descents.
- Measure distance using the scale.
- Note landmarks (rivers, roads, shelters).
- Trace the route considering the terrain relief.
8.2 Creating a simple topographic map from a DEM (summary workflow)
- Obtain a Digital Elevation Model (DEM).
- Import the DEM into mapping software.
- Automatically generate contour lines.
- Add symbols and legend.
- Export the map in the desired format.
9. Conclusion — summary and call-to-action
The topographic map definition is now clear: it’s an accurate tool representing relief and landscape elements to better understand and navigate a territory. Whether for hiking or a professional project, mastering map reading greatly facilitates terrain analysis. To go further, you can check an interactive topographic map or discover how eSIM technology can support your travels with peace of mind.
To prepare your next outing, don’t hesitate to equip yourself with a reliable topographic map and learn to use its symbols and contour lines. You will gain autonomy and safety in the field.